Cocitation Network Graph Mapping a wider field
The dynamic Cocitation Network Graph provides a way of visualizing the conversations among scholars that have occurred in Signs. Each circle that appears on the graph represents a source that has been cited by at least four articles in Signs. The links between these circles indicate that the two linked sources have been cited together (i.e., within the reference list of the same article) at least four times. A static image of the full graph is available, but the interactive version of the graph is more informative. The interactive graph is best viewed on wider screens and in an up-to-date browser.
Exploring the Graph
Rather than mapping articles published in Signs, the graph provides a way of viewing the broader field of feminist scholarship that is reflected in the sources cited in the articles that the journal publishes. The assumption operative in this type of graph is that scholarship can be viewed as conversations among various participants represented by particular sources; sources that tend to be cited together are being put into conversation with one another and are thus representative of a particular strain or school of thought within a field.
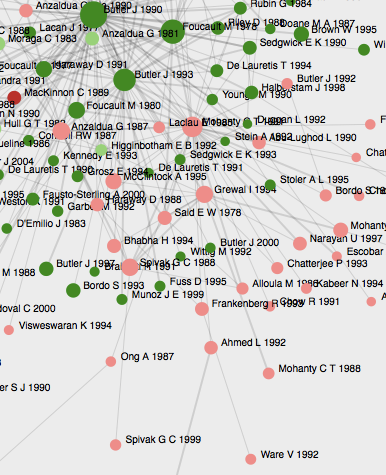
In this case, Judith Butler's 1990 work Gender Trouble is a central node, to which many other works are connected (meaning that they have been cited alongside Gender Trouble in Signs articles). Chandra Talpade Mohanty's "Under Western Eyes" and Nancy Chodorow's The Reproduction of Mothering are also central nodes. On the interactive graph, you can hover over each node to see which other nodes are connected to it. Hovering will also reveal the full citation information for each source as well as the total number of times that the source is cited in Signs, according to the Web of Science database, which is the source of this data. One can also drag the circles to make it easier to discern connections or labels. Once dragged, a node will become "sticky." To "unstick" the node, double-click on it.
The size of each circle is a function of the number of total citations it has accrued. The thickness of the links between nodes is a function of the number of times the sources have been cited together. The color of the nodes is determined by the Louvain community-detection algorithm.
Data and Construction
Much of the programming for this graph was provided by Jonathan Goodwin of the University of Louisiana at Lafayette, who has worked extensively in creating cocitation network graphs and has included Signs in several graphs of multiple journals and has also produced topic models of Signs. He also provided the data downloaded from Web of Science. This data includes the citations from the first issue of Signs to the winter 2013 issue (vol. 38, no. 2).
The data was cleaned in order to regularize many author names and the dates of some sources. As mentioned above, sources only appear on the graph if they meet the following requirements: 1) they are cited more than four times, and 2) they are cocited along with another source at least four times. This means that the graph does not necessarily show all of the most-cited sources, since if a source is cited in more than four Signs articles but is not cited alongside another specific source four times, it will not appear on the graph.
This has resulted in a graph of 223 sources (or "nodes") and 426 links (or "edges"). Because of data errors and the way that the data file is generated, it is possible that multiple editions of the same work appear as separate nodes and that different works by the same author published in the same year may have been merged into one node, though this is unlikely.
The Python script used to generate the citation network data file was created by Neal Caren. The network graph itself relies on the d3.js library by Mike Bostock.